Where does public money
go in ?
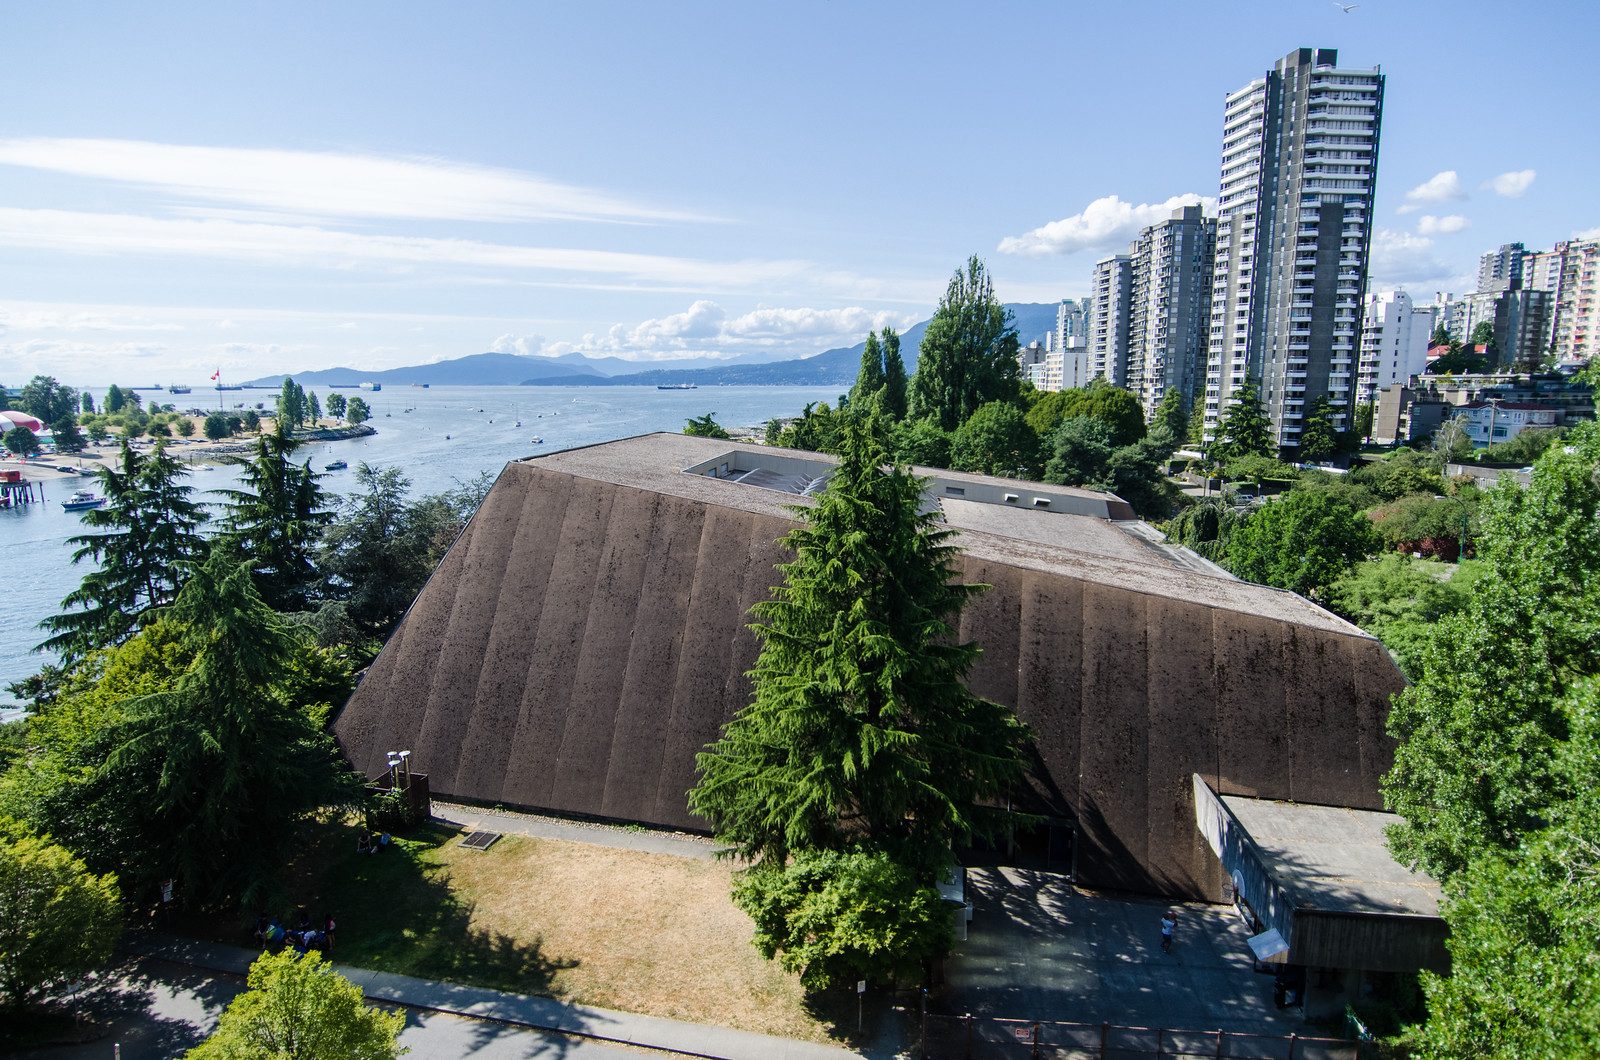
Vancouver Aquatic Centre
$177M
Explore this place
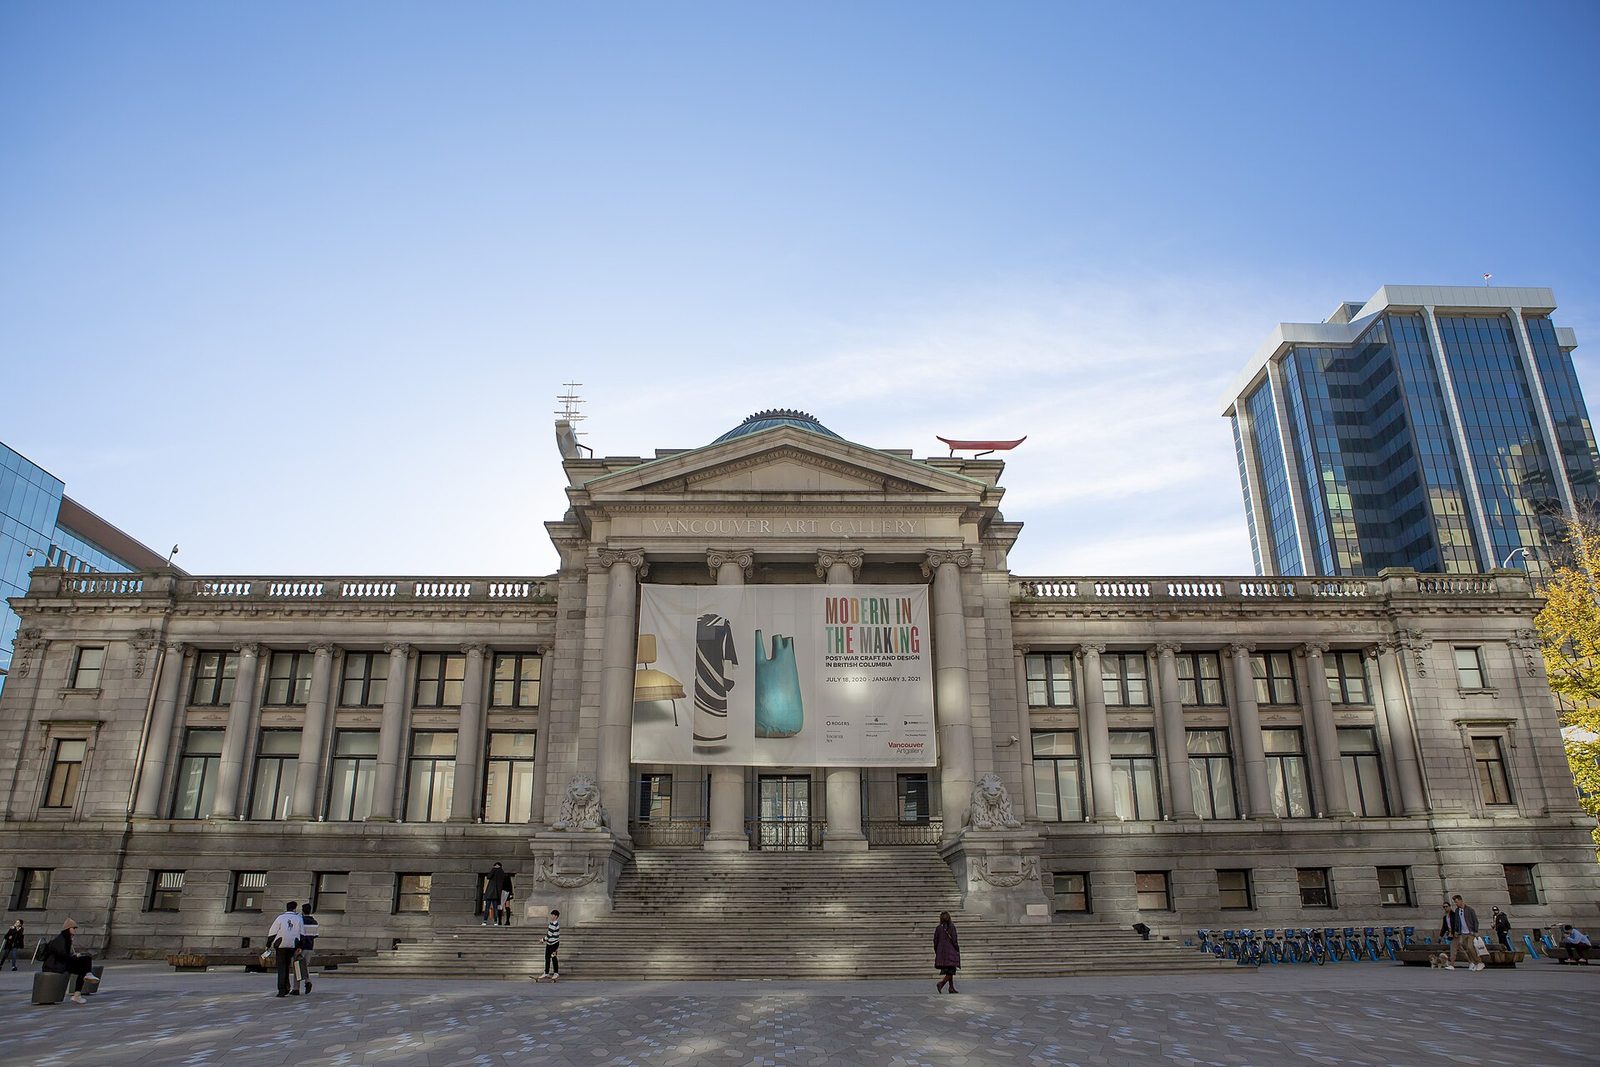
Vancouver Art Gallery
$32.7M
See the recipient page
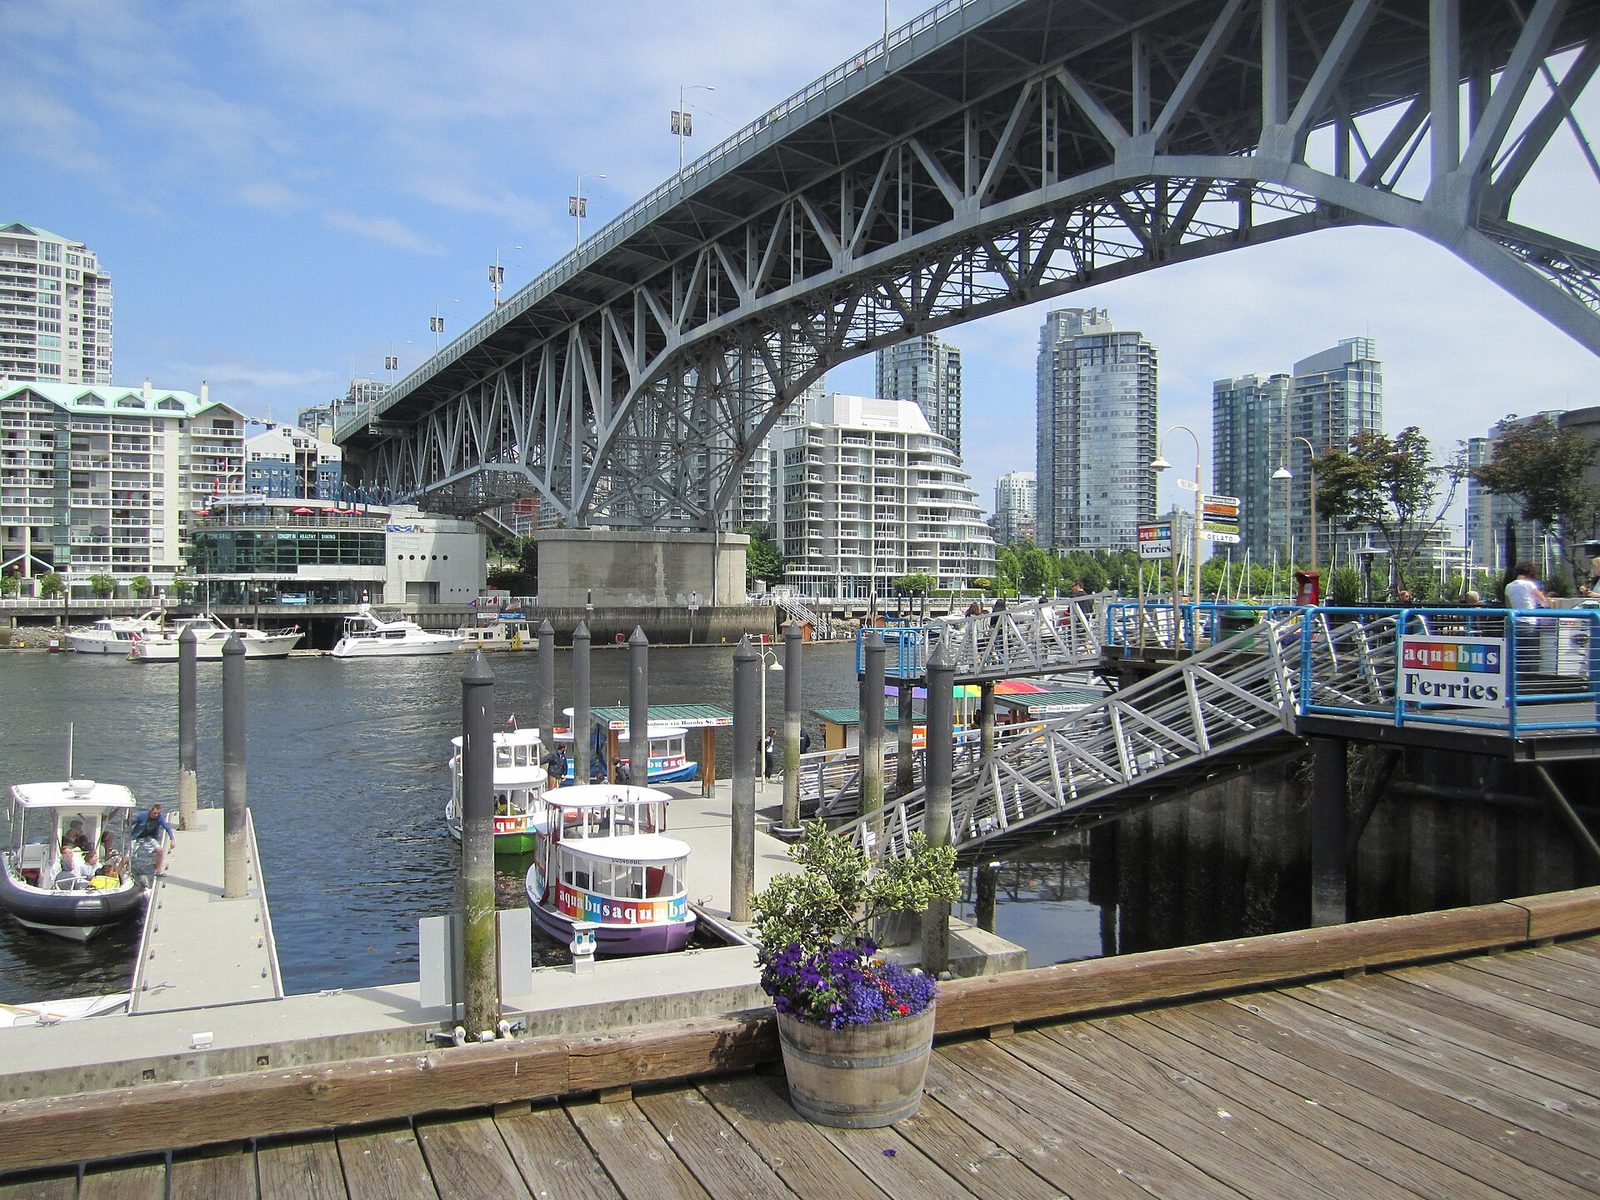
Granville Bridge Interim Connector and North Loops Reconfiguration
$29.6M
See every offer
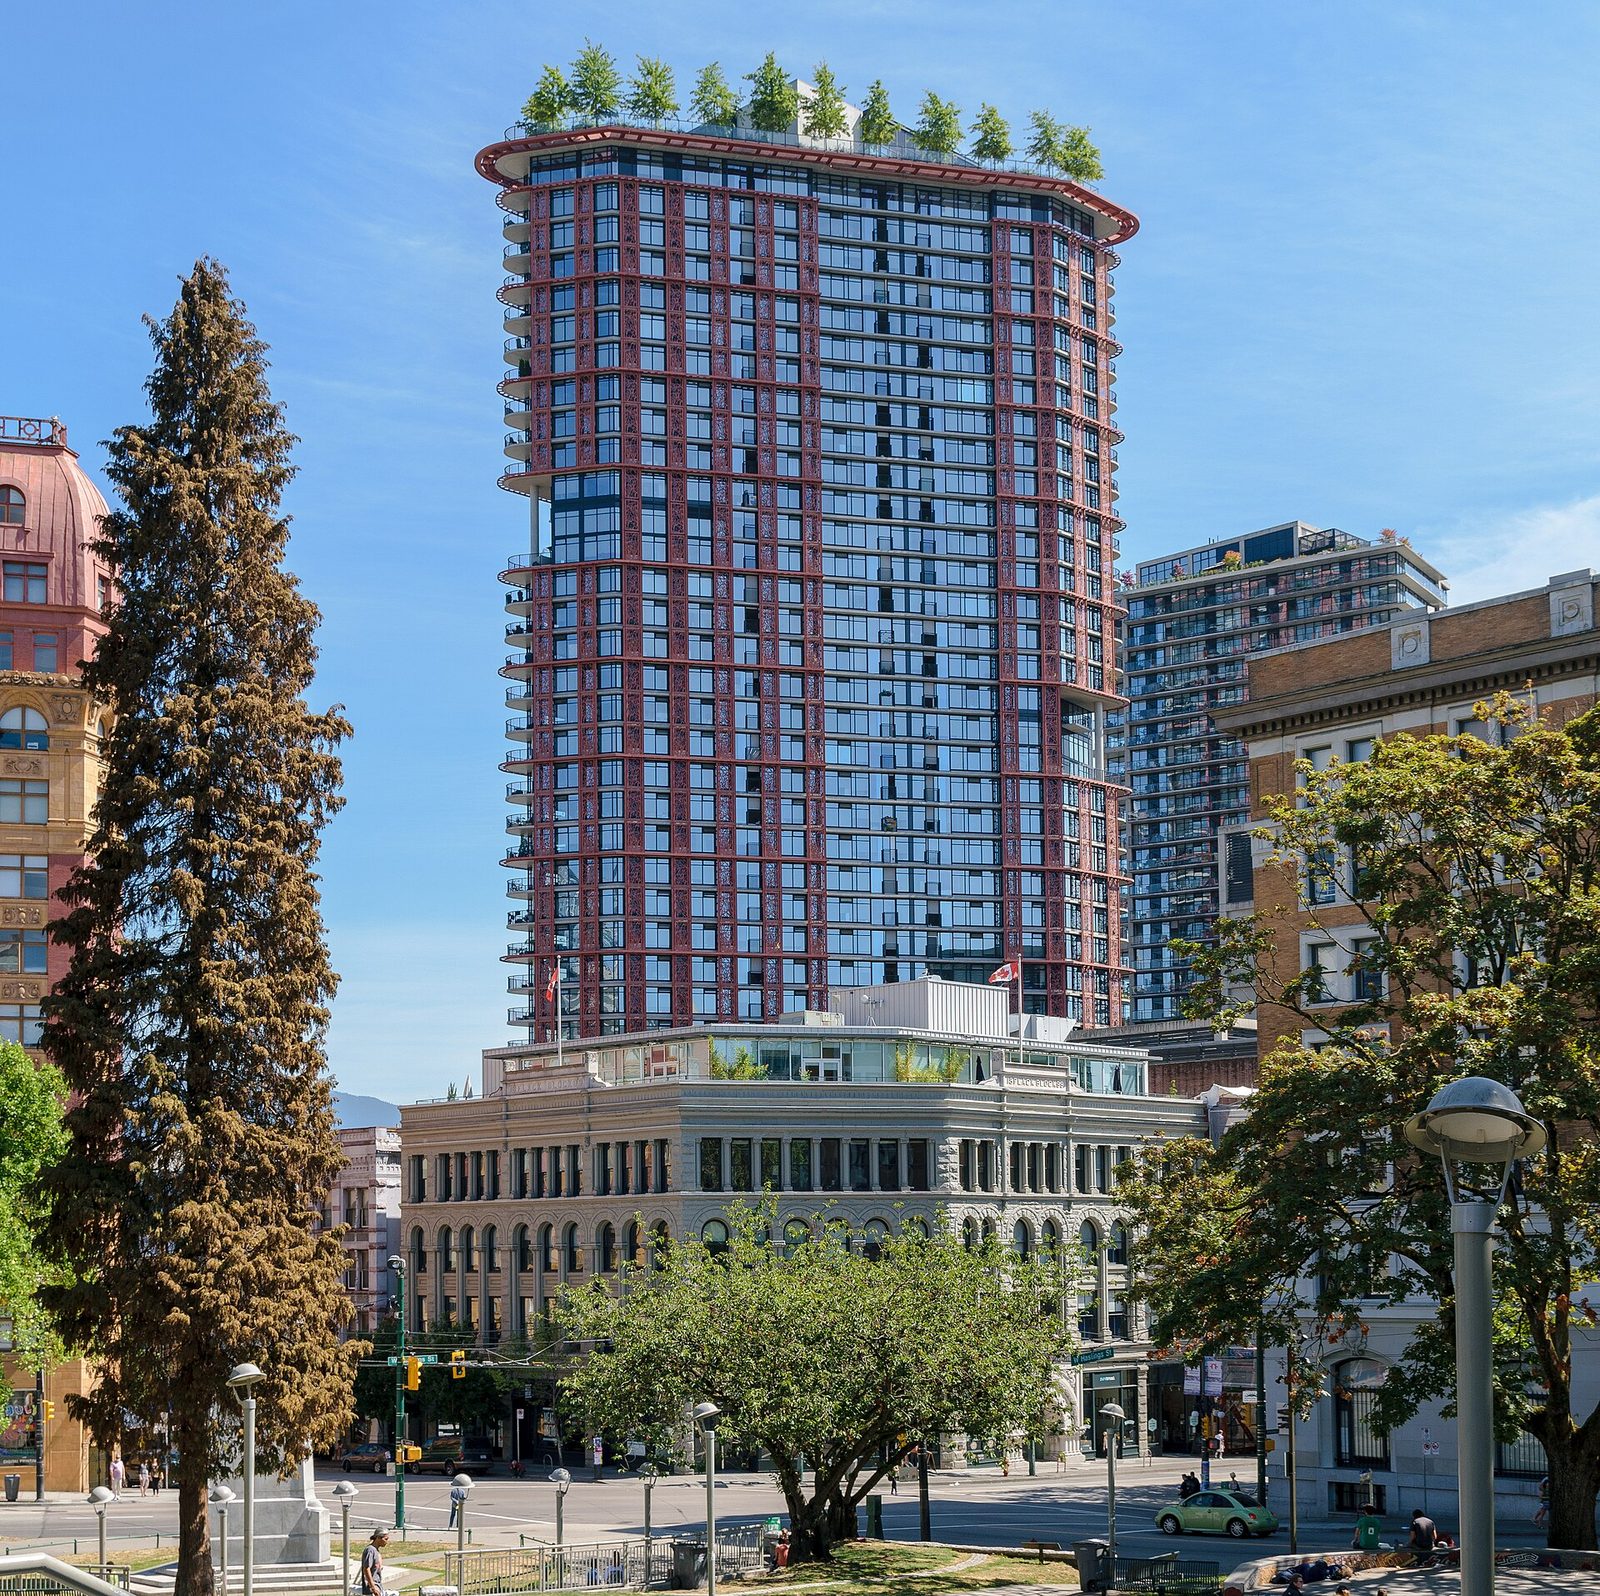
Affordable Housing Societies
1,328
See the operator page
$286per resident, per month
$2.55B spent in 2025 · 740,454 residents
Explore every section.
- The cityEvery building, tree and council decision, in 3D, year by year.
- BudgetSpending by service and by kind of cost, revenue by source, 2015–2025.
- Who gets paidEvery supplier over $25,000 and every grant, named, since 2011.
- ContractsEvery competition: who bid, at what price, who won.
- PayrollEmployees paid over $75,000, by department and role.
- InvestmentsCapital budgets, how projects are funded, every program.
- PlacesTheatres, parks, bridges, community centres — and the City money tied to each.
- HousingEvery non-market housing building: units, clientele, operators.
- DebtWhat the City owes, its sinking fund and its reserves.
- Council decisionsEvery item council voted on, with its tally and the parcels it names — downloadable.
Auditable.
Every source is public
36 datasets from the City’s open-data portal, 15 archived copies of its Statements of Financial Information (2011–2025), its council minutes and voting record. Every page names the file it reads.
See sources →Every total is checked
Each schedule is added up and set against the total the City prints under it. Where the two differ, or a report misprints a year, the sources page says where and by how much.
Read the checks →No one is named by accident
A payee or a bidder whose name could be a person’s is counted, never printed. Employees paid over $75,000 are counted by department, role and pay band, never listed.
The privacy rules →This site can exist for your city.
It is built from the data the city already publishes.