The City’s places
$44.1M in FY2018 · $253.1M in FY2024 (the highest) · $193.7M in FY2026
Click a year to see its amount.
Fiscal years run July to June; a hatched year is still being closed.
Port, transit & fire: 19 places
Click a place to open its page.
 Pier 80 Port facility · Port of San Francisco$650,000
 James R. Herman Cruise Terminal (Pier 27) Cruise terminal · Port of San Francisco$49,869
 Pier 27 Port facility · Port of San Francisco$49,869
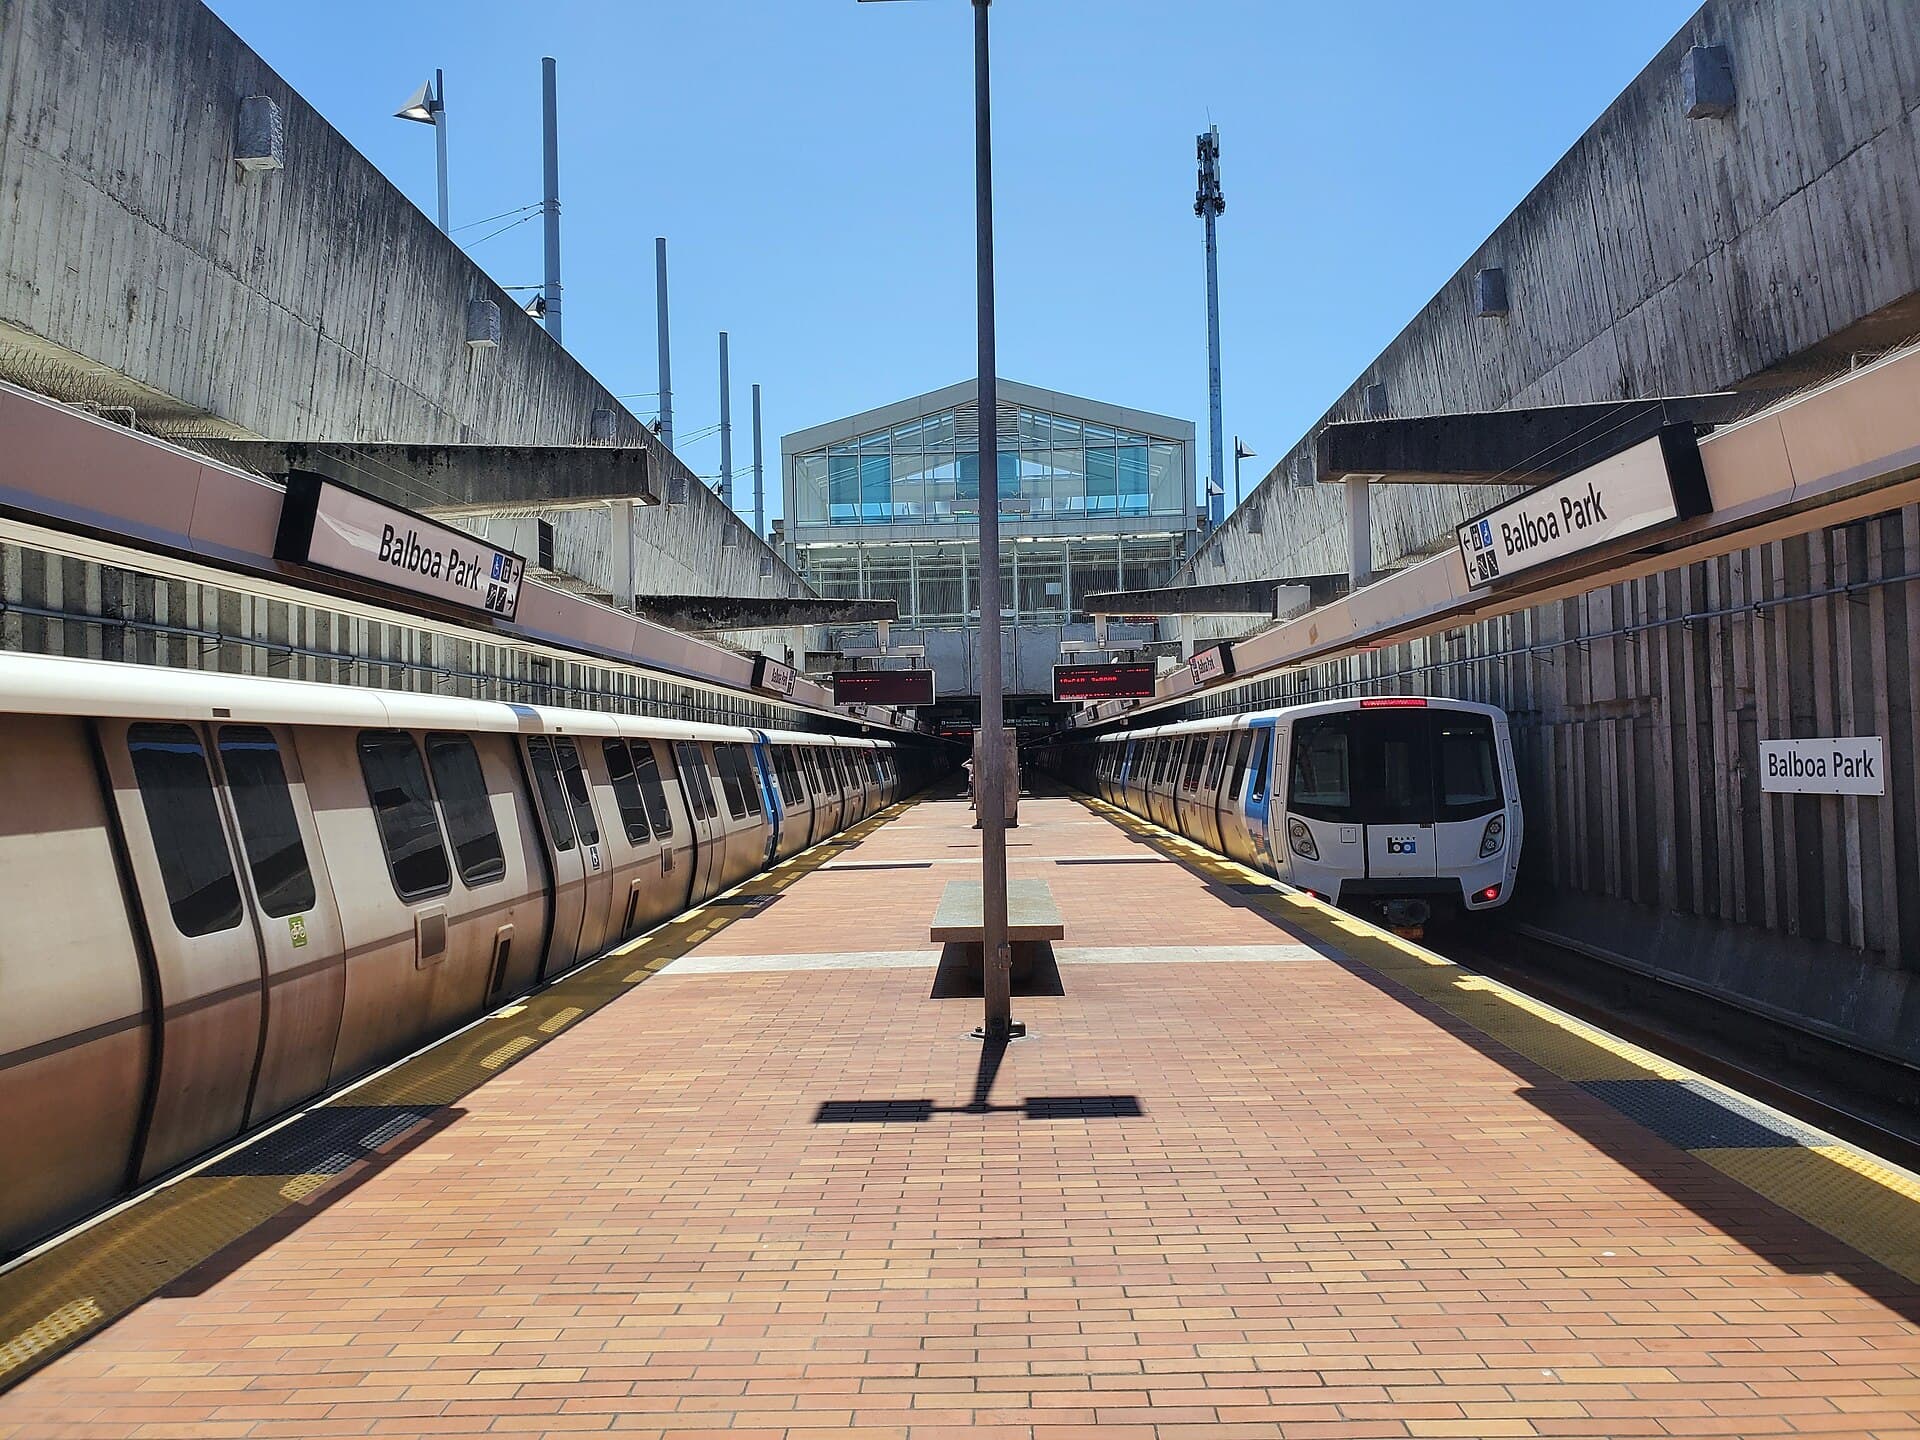 Balboa Park Station / Green Yard Rail yard / station · Municipal Transportation Agency—
 Cable Car Barn & Powerhouse Transit facility / museum · Municipal Transportation Agency—
 Ferry Building Terminal / market · Port of San Francisco—
 Fire Station #13 Fire station · Fire Department—
 Fire Station #14 Fire station · Fire Department—
 Fire Station #15 Fire station · Fire Department—
 Fire Station #18 Fire station · Fire Department—
 Fisherman's Wharf Waterfront district · Port of San Francisco—
 Muni Presidio Division Trolley yard · Municipal Transportation Agency—
See all 19 places
 Muni Woods Division Bus yard · Municipal Transportation Agency—
 Pier 39 Pier · Port of San Francisco—
 Pier 45 Port facility · Port of San Francisco—
 Pier 70 Pier / shipyard · Port of San Francisco—
 Pier 96 Port facility · Port of San Francisco—
 SFFD Division of Training Training facility · Fire Department—
 SFFD Station 1 Fire station · Fire Department—
Find a place
By name, by kind of place or by department.
Understand
What counts as a place here?
95 places everyone knows, chosen by us: parks, libraries, hospitals, piers, fire stations. Each publishes with a cleanly licensed photo, at least three Internet Archive documents and a verified money link. It is a selection, and it grows.
What does the figure count?
A place’s amount is what the City paid contractors for work there in the fiscal year shown (July to June), from its payment ledger. Voter-bond spending and building permits are not added in: a bond pays the contract that does the work, and a permit declares the same job’s cost. 73 places have no payment on record that year; nothing says they cost nothing.
Where do these numbers come from?
The SF Controller’s contracts and payments on DataSF, the City Facilities registry, the GO Bond datasets, and the documents held at the Internet Archive. Every fact on a place’s page carries its link.
DataSF ↗ · Internet Archive ↗ · JSON ↗ · Full method for this page →
Source: City and County of San Francisco (DataSF: contracts, payments, facilities, GO bonds); Internet Archive (documents). Amounts are contract payments in the fiscal year shown.